
Россия, Смоленск

СДЕЛАЙТЕ СВОИ УРОКИ ЕЩЁ ЭФФЕКТИВНЕЕ, А ЖИЗНЬ СВОБОДНЕЕ
Благодаря готовым учебным материалам для работы в классе и дистанционно
Скидки до 50 % на комплекты
только до
Готовые ключевые этапы урока всегда будут у вас под рукой
Организационный момент
Проверка знаний
Объяснение материала
Закрепление изученного
Итоги урока

Была в сети 20.04.2024 09:55

Звонкова Татьяна Юрьевна
Учитель английского языка
42 года
Местоположение
Специализация
Инфографика на уроках английского языка (статья с приложением)
Категория:
Английский язык
11.06.2023 15:24

Просмотр содержимого документа
«Инфографика на уроках английского языка (статья с приложением)»
Infographics and language learning.
Why visual literacy matter so much nowadays in education? Surely, language and text-based approaches should still take precedence? Doesn't the image just distract from the word? This attitude towards the concept of visual literacy is commonly heard but could not be further from the truth. It is precisely the combination of text and image that is the crucial point to explore.
Contrary to popular belief, there are no clearly expressed learning styles. We all absorb information through a mix of channels such as visual, audio, and sensory. However, studies show that including visuals in a learning material can help students comprehend and retain information better. Infographics are the most useful type of visual aid when it comes to learning. They can make complex concepts more digestible and even improve student engagement. Also, they allow you to provide additional context and, therefore, make your lessons more complete.
Consider for a moment the new multimodal ensembles that are available in today's coursebooks — from word clouds to infographics, from augmented reality posters to kinetic typography lectures. In these examples, rather than distracting from the text, the image actually enhances it. The visual turn of recent years has led to important changes in the design of ELT materials. Previously, language coursebooks were filled with illustrations but did not take the image seriously, either from a methodological or an aesthetic point of view. However, in an effort to resemble something other than language coursebooks and grant them a magazine-like layout, the size and role of infographics has increased and simple illustrations became less frequent.
So, why infographics are extremely popular in modern education? We would like to mention three main advantages of the usage of infographics.
1. Infographics increase attention span
“Timing is everything” is a proverb that stays true in both life and education. The way teachers use their first 10-15 minutes in a class will decide the rest of the lesson. Likewise, how lessons are organized affects how well students absorb and remember the material. In other words, using infographics to clarify a difficult concept in education can help students in grasping the larger picture and understand the forest for the trees.
2. Infographics summarize information
There is an old adage: “A picture is worth a thousand words”. A single image still can express complex ideas more effectively than only verbal language. In other words, puzzling written information can be simplified just by using image(s). Rather than presented with blocks of text, infographics also have a number of design formats with different purposes. Teachers can use infographics in education such as summarize info, timeline, process, or sum up statistics from research.
3. Infographics improve memorization
Infographics are an effective way to grow memory because they present information in a visual format. This makes it easier for students to retain the information. On average, people only remember 10% of the information for three days after hearing it, but adding a visual image can increase recall to 65%.
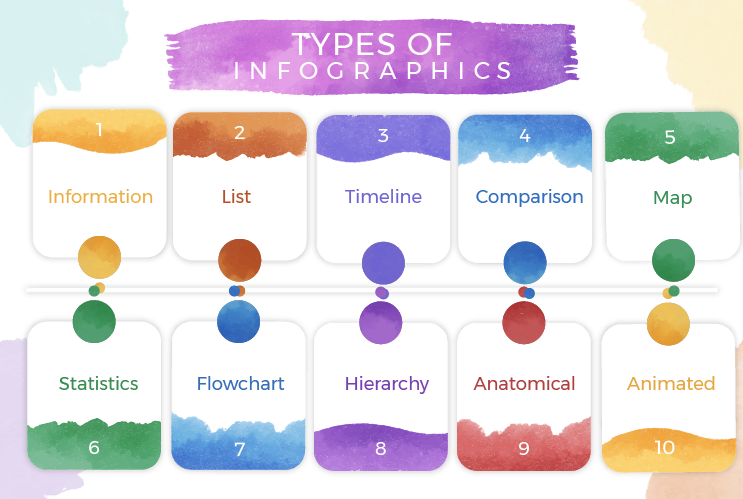
There are 10 main types of infographics

The usage of infographics brings us to the particular skills and abilities that a visually literate learner can claim to possess. This is perhaps best understood by appreciating how we view an example of infographics in different ways. Callow (2005) established three dimensions of viewing: affective, compositional and critical (Callow 2005:13). The affective focuses on the individual's sensual and immediate response; the compositional includes the identification of semiotic, structural and contextual elements; and the critical foregrounds sociocultural considerations and highlights the message of infographics, requiring us often to look beyond an image's literal meaning. Callow quotes Kress and van Leeuwen's assertion (1996:12) here: 'All images, even apparently neutral ones, are entirely in the realm of ideology'. This paradigm is echoed in the model proposed more recently by Serafini (2014:43), who defines the dimensions of viewing as perceptual, structural and ideological.
Examples of questions and tasks to help learners analyze infographics
| AFFECTIVE/ PER C EP T UA L | COMPOSITIONAL/ STRUCTURAL | CRITICAL/ I D E O LO G I C A L |
| How does the image make you feel? | What elements can you see in the foreground/background, etc.? | What message does the image transmit? |
| Why does it make you feel this way? | What text accompanies the image, if any (a caption, a title, etc.)? What does it add to the image? | Who created it? For what purpose and in what context? |
| What other images come to mind when you see it? | How is the image framed or composed? | In what forms of media will the image be seen? |
| What personal relevance does it have for you, if any? | What do you think lies beyond the frame? | Who is the intended audience for the image? |
| What does the image remind you of? | From what angle or point of view has the image been taken? | In what context did you view the image? The original context or another one? What is the difference?
|
| Do you identify with or relate to the image in any way? If so, how? | Which parts of the image are centrally focused? | In how many different ways could the image be interpreted? |
| Do you think the image is positive or negative? Or do you feel indifferent towards it? Why? | What has been altered, omitted from or included in the image? | Are any of the images stereotypical, idealized, non-representative or anachronistic? |
All in all, using infographics is mainly regarded as a visual aid to enhance the educational experience. This kind of modern-age tool empowers both teachers and learners to be more flexible and creative in teaching activities.
References:
1. Callow J. Literacy and the visual: Broadening our vision. English teaching: Practice and critique. London: Routledge. - 2005.
2. Kress G. and van Leeuwen T. Reading images: The grammar of visual design. London: Routledge. – 1996.
3. Serafini F. Reading the visual: An introduction to teaching multimodal literacy. New York: Teachers College Press. – 2004.
.
2


Вебинар для учителей
Свидетельство об участии БЕСПЛАТНО!
Полезное для учителя

Реализация образовательных программ осуществляется с применением исключительно электронного обучения и ДОТ